Environment & Energy
Related: About this forumPR: Eco Wave Power Receives Final Permit from U.S. Army Corps of Engineers for First Onshore Wave Energy Project at ...
https://www.ecowavepower.com/eco-wave-power-receives-final-permit-from-u-s-army-corps-of-engineers-for-first-onshore-wave-energy-project-at-port-of-los-angeles/Mon, Nov 18, 2024 13:30 CET
Los Angeles, CA – November 18, 2024 –Eco Wave Power Global AB (Nasdaq: WAVE) (“Eco Wave Power” or the “Company”), a leading provider of onshore wave energy technology, is pleased to announce it has received the final Nationwide Permit (NWP) from the U.S. Army Corps of Engineers for its groundbreaking wave energy project at AltaSea’s premises at the Port of Los Angeles.
This milestone marks a significant step forward in the development of Eco Wave Power’s pioneering wave energy project, which is set to become the first onshore wave energy installation in the United States. The permit, issued under NWP 52 for Water-Based Renewable Energy Generation Pilot Projects, authorizes Eco Wave Power to install eight wave energy floaters on the piles of an existing concrete wharf structure on the east side of Municipal Pier One.
The system will also include an energy conversion unit, comprised of two 20-foot shipping containers, which will be placed on the wharf deck and connected to the floaters. With the conversion unit already shipped and located on site, Eco Wave Power plans to complete installation by the end of Q1 2025.
…
“We are thrilled to receive this final permit and move one step closer to bringing wave energy to the U.S.,” said Inna Braverman, Founder and Chief Executive Officer of Eco Wave Power. “This project represents not only a technological breakthrough but also a crucial step in advancing the global transition to renewable energy. We are deeply grateful for the support of AltaSea, the Port of Los Angeles, Shell MRE, and the U.S. Army Corps of Engineers as we work to make wave energy a key part of the sustainable energy landscape.”
…
NNadir
(34,847 posts)...more shorelines to lace with plastic floats and wiring, so let's get to it.
Of course, LA harbor, if one has been there, is already an industrial park, so it's not quite as bad as say, tearing the shit out of thousands of square miles of once pristine desert in California for wind turbines that can't produce as much electricity as the Diablo Canyon Nuclear Plant can produce on a 12 acre footprint.
Diablo Canyon Nuclear Plant Output 2023 (12 acre footprint): 17,714 GWh.
All the fucking wind turbines in California 2023 spread over untold square miles of ruined landscapes: 13,920 GWh.
California Energy Commission (accessed 11/19/2024).
Personally, I've been hearing about wave power for my whole adult life, and I'm certainly not a young man.
All that bullshit, promoted on websites powered by electricity overwhelmingly generated by gas and coal hasn't done a damned thing to change this outcome:
Week beginning on November 10, 2024: 423.60 ppm
Weekly value from 1 year ago: 421.00 ppm
Weekly value from 10 years ago: 397.33 ppm
Last updated: November 18, 2024
Weekly average CO2 at Mauna Loa
But of course, we shouldn't give a flying fuck about numbers, should we? It's FIRST!! On Shore Wave Power, FIRST!! Hydrogen This! FIRST!! Hydrogen That! FIRST!! Solar! FIRST!! Wind, year after year, decade after decade, no matter how many fossil fuels are burned, no matter how much wilderness burns from extreme global heating.
The chants have lost all meaning, long after the reactionary fantasy lost all sense of rationality. The reactionary "renewables will save us" rhetoric has played out, in flames.
It's certainly not the FIRST!! time we've heard carrying on about wave power, which doesn't, after decades of hearing about it, doesn't even show up in the WEO data below as measurable.
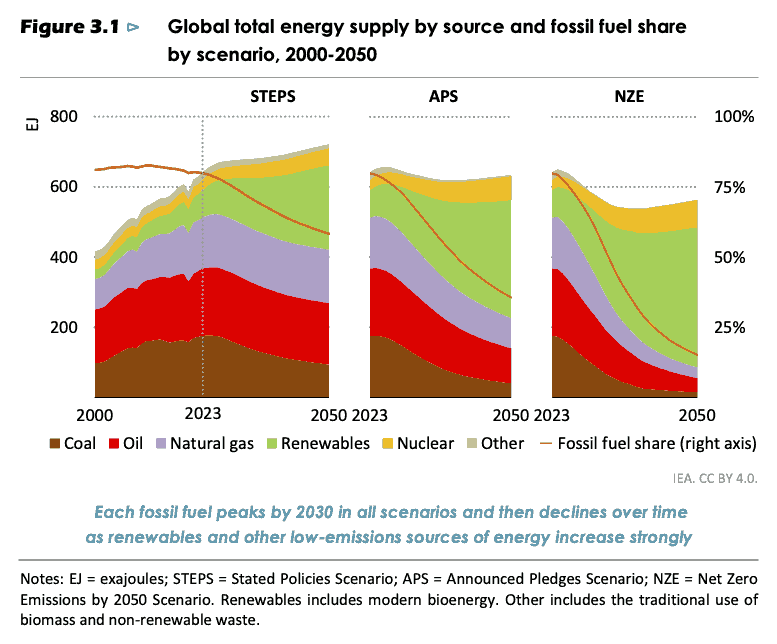
It's 2024. It is still true that 8 + 8 EJ (solar and wind) is not greater than 30 (nuclear) EJ, nor is it an appreciable fraction of 676, in percent talk, certainly not one that matters a little over 2%, this after trillions squandered on solar and wind, this on a planet where over 1.5 billion people still do not have basic sanitation services, such as private toilets or latrines.
Happy talk! Of course, I'm less than happy that there are people who believe that 8 + 8 is greater than 30, and who lack the intellectual depth to stop crowing about as much. Floating crap in Los Angeles Harbor is not going to a damned thing to slow the vast ongoing tragedy.
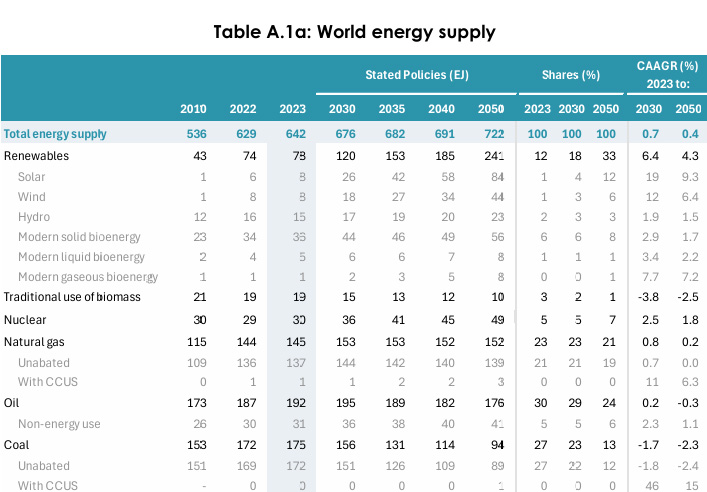
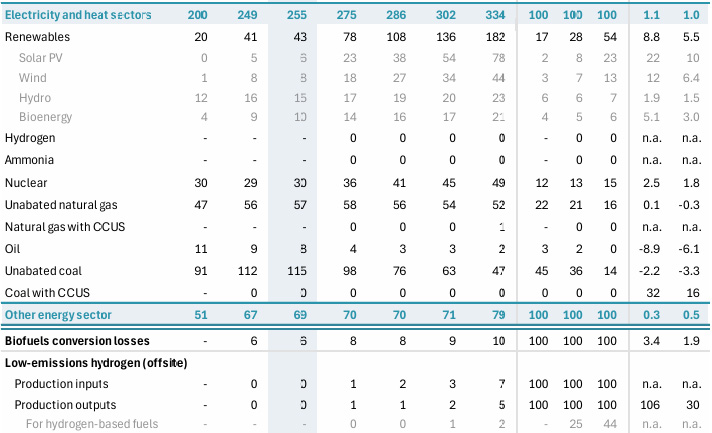
IEA World Energy Outlook 2024
Table A.1a: World energy supply Page 296.
jfz9580m
(15,584 posts)Your title ..the plan (if you can call it one) seems to be to destroy every damn ecosystem as fast and recklessly as possible through total deregulation, misinfo, overconsumption and population explosion (cheap labor and cheap consumer good sales so people don’t notice they lack healthcare, access to education/better lives etc) while spinning fantasies about colonies on Mars.
Our media is junk..
OKIsItJustMe
(21,021 posts)OKIsItJustMe
(21,021 posts)OKIsItJustMe
(21,021 posts)OKIsItJustMe
(21,021 posts)OKIsItJustMe
(21,021 posts)NNadir
(34,847 posts)...will transform a Watt into a Joule however. The Watt is a Joule/sec, and the big lie is that so called "renewable energy" junk doesn't operate 86,400 seconds per day.
Table A.1a in the report, which I won't bother to show again since numbers don't seem to matter, should clearly show that 8 EJ (wind, 2023, same as 2022) + 8 EJ (solar 2023) does not equal the 30 EJ nuclear). I note once again that proponents of this multitrillion dollar failed "renewables will save us" scheme show zero interest in the rising use of fossil fuels. Their interest has always been and still is to attack the only high energy density low carbon form of scalable energy there is, nuclear energy.
After more than 4 decades, their interest is not in a burning planet but rather in whining about Three Mile Island.
As for reproducing graphics from the WEO, without demonstrating a whit of understanding, I'm not impressed or moved. I have issues going back decades, and all the charts and graphs therein have done nothing at all to address the extreme global heating now observed worldwide. The data is useful, the soothsaying, not at all. Unless, by the way, the outcome is not what the soothsaying predicts, the planet and all living things on it are fucked.
I now return the conversation to TMI whining. How many people died from the radiation leaks associated with the 1978 TMI meltdown again. As many as have died from the fossil fuel waste released to power computers to discuss it?
Got a chart?
OKIsItJustMe
(21,021 posts)You keep posting and reposting the same table, ignoring reality.
NNadir
(34,847 posts)Last edited Wed Nov 20, 2024, 07:49 AM - Edit history (1)
...can tell the difference.
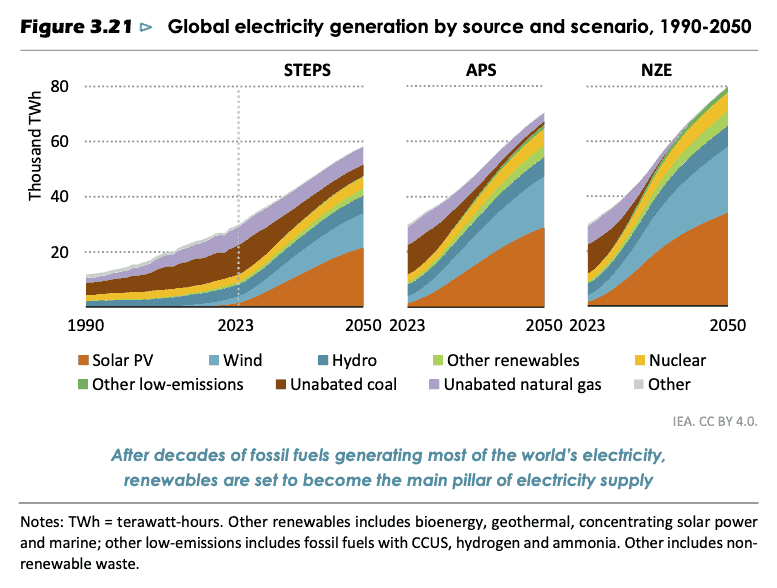
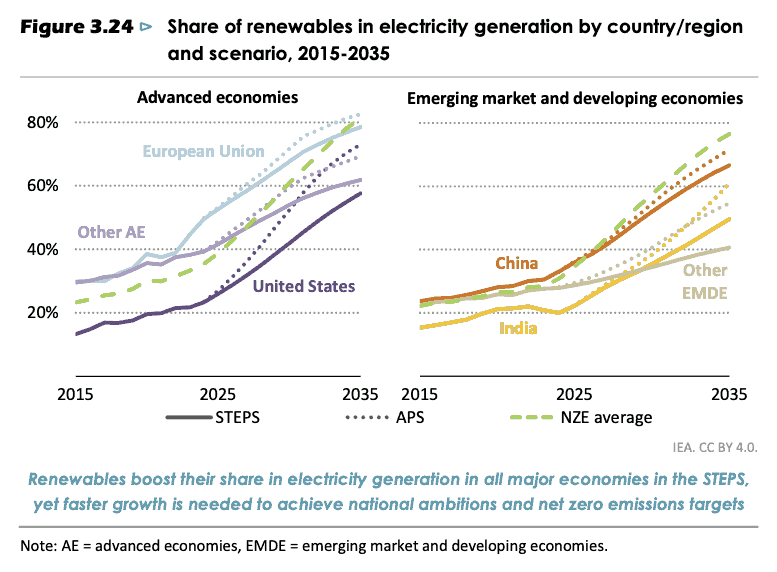
Someone posting, for instance, figure 3.21 as if it were realistic, is crediting soothsaying, not reality. Actually, a person who wishes to use the word "reality" in any connection with soothsaying reveals exactly and unambiguously how unqualified they are to use the word at all.
Of course, I have in my file every copy of the WEO going back to the late 1990's, so I'm experienced with them. I don't think I qualify as a credulous rube. The "scenarios" year after year after year after year don't mean shit.
Apparently, there are people who can look at a graph and not glean what i says, which seems to be the case here. In figure 3.21, we can see, if we look at the position of "2023" one can see what the multiple trillion dollar (that's money already squandered) solar industry is producing Now, which is next to nothing. This is true of scenario "STEPS," "APS," and "NZE"
Particularly amusing is what the soothsaying says about hydro, when the overheated planet is already suffering extreme droughts and the disappearing of glacial sources that fed rivers for millennia.
Have a nice day.
OKIsItJustMe
(21,021 posts)No soothsaying allowed. We especially don’t want stated policies. We know those are simply political, and are certainly not a trustworthy indication of the future.

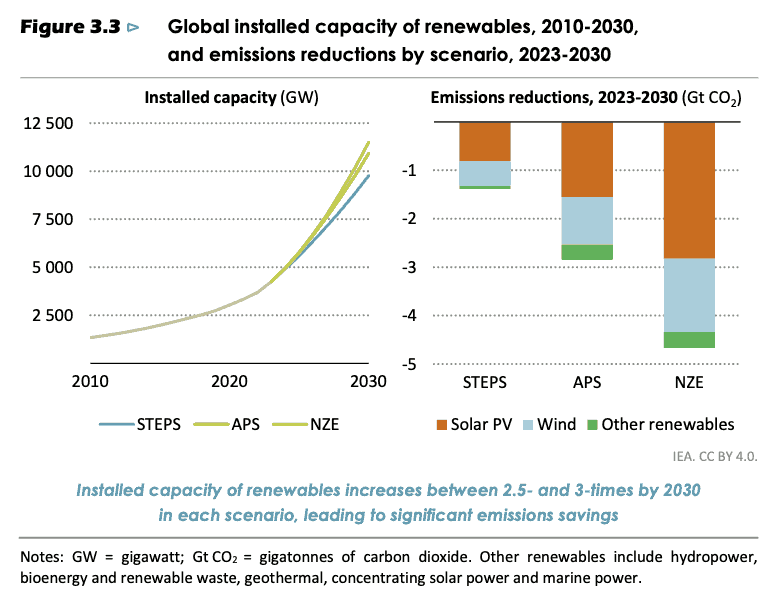
Now, this figure (for example) includes no soothsaying. It only includes data from 2010 through 2023, but, since it does so visually, it is easy to pick out trends over time.
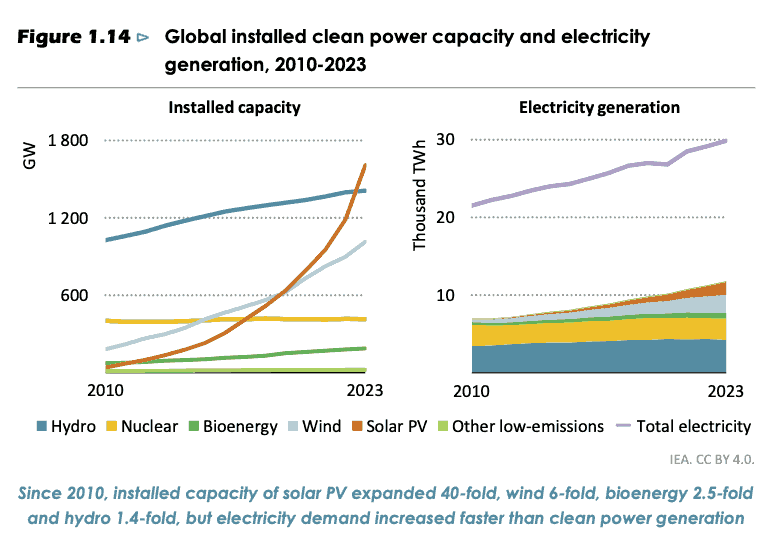
A keen eye may be able to differentiate between a growth curve and a straight line.
NNadir
(34,847 posts)...an exercise for a junior high school science class that is, to make a distinction between a Watt and a Joule.
It also makes a difference when the energy is produced, but if we're on a junior high school level here, perhaps any education with respect to that will be irrelevant.
The fact that trillions of dollars have been squandered on solar energy for a trivial result, no result in fact with respect to the now observed extreme global heating, should also point to economic efficiency, but understanding as much may again call for a high school level of economics.
Twenty years ago, when the antinuke assholes had their way, they engaged in soothsaying that claimed if as much money was spent on so called "renewable energy," as nuclear, the nuclear industry would disappear. The amount of money squandered on so called "renewable energy" dwarfs the amount spent on nuclear, with the observed result that the planet is in flames, and the nuclear industry is still here, doing far less than it might have done were it not for rank stupidity.
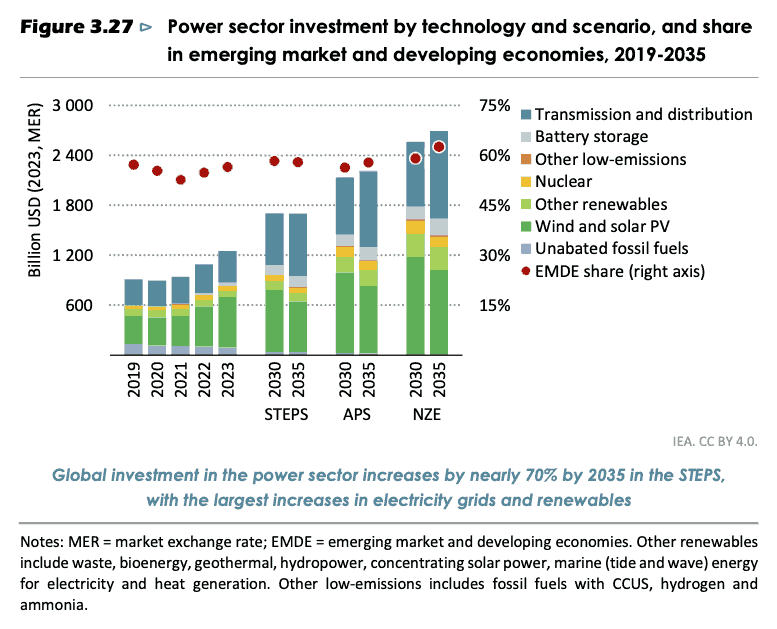
The amounts so squandered on solar and wind are in the report by the way, if one is literate enough to grasp cost vs. result. The IEA also has a real time web page with the updated expenditures on solar and wind vs. nuclear. The numbers are absolutely appalling given the result.
Sophisticated LCA papers, of which there are thousands in the literature, make a clear representation of the relative external costs, costs to the environment and human health, but these papers are beyond, almost certainly, the intellectual reach of people who cannot distinguish between a Joule and a Watt.
A disinterest in attacking fossil fuels, on which the solar and wind industries depend is duly noted. I have yet to meet an antinuke who is seriously interested in attacking the fossil fuel industry with the same intensity with which the raise specious attacks on nuclear energy.
The results of these attacks on sustainable energy, of which there is only one form, nuclear energy, are in unambiguously. The planet is literally burning.
OKIsItJustMe
(21,021 posts)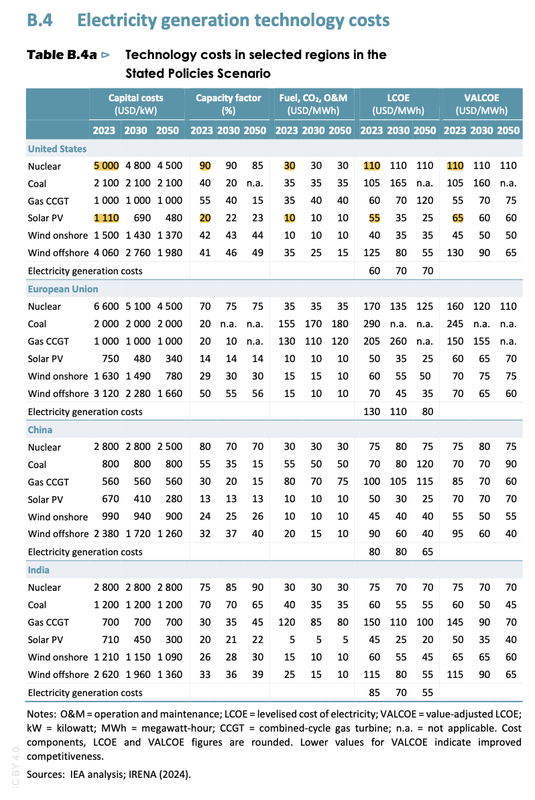
OKIsItJustMe
(21,021 posts)Just in case it’s difficult for you to read the entire table:
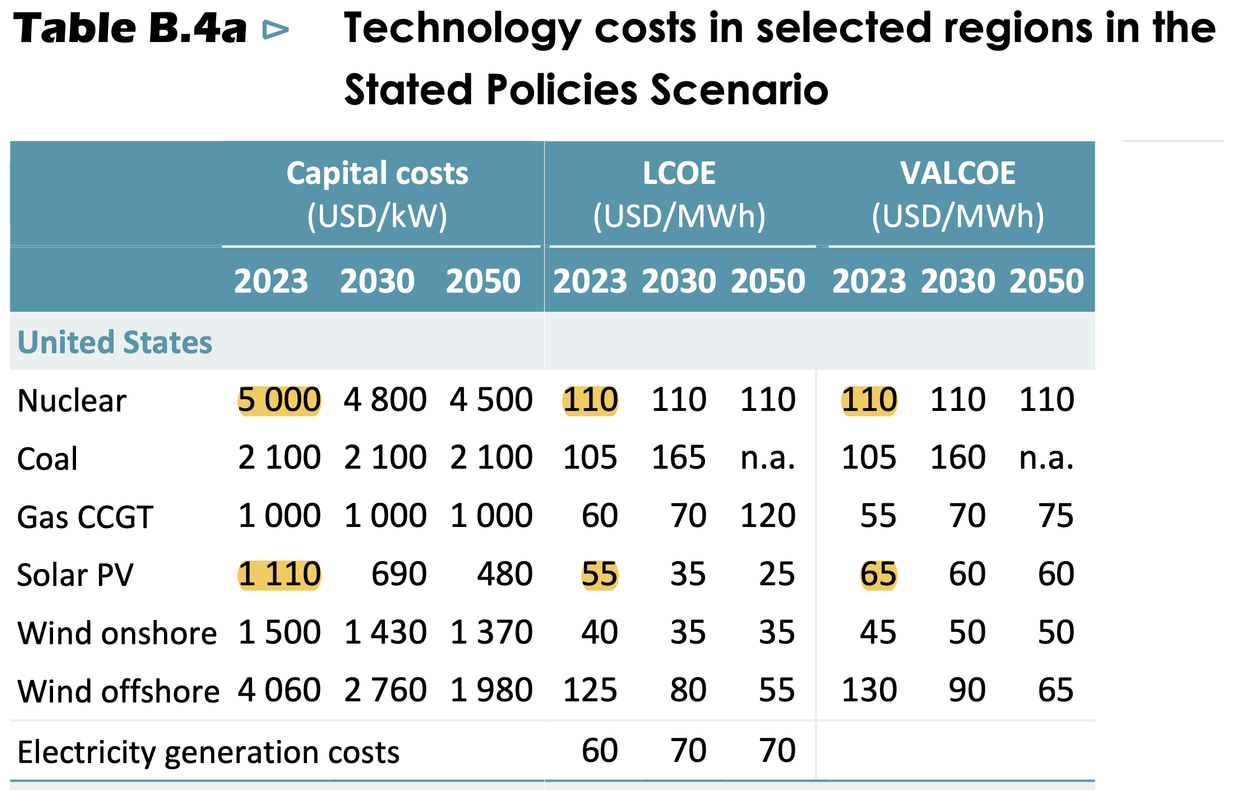
Notes: O&M = operation and maintenance; LCOE = levelised cost of electricity; VALCOE = value-adjusted LCOE; kW = kilowatt; MWh = megawatt-hour; CCGT = combined-cycle gas turbine; n.a. = not applicable. Cost components, LCOE and VALCOE figures are rounded. Lower values for VALCOE indicate improved competitiveness.
Sources: IEA analysis; IRENA (2024).
OKIsItJustMe
(21,021 posts)OKIsItJustMe
(21,021 posts)OKIsItJustMe
(21,021 posts)OKIsItJustMe
(21,021 posts)OKIsItJustMe
(21,021 posts)Table A.1a is taken from an Annex - Tables for scenario projections
Projections which NNadir doesn’t like are called “soothsaying.”
Here are a couple of other tables from the same Annex:


International Energy Agency | World Energy Outlook 2024

